Debugging memory leaks in Ruby without crying
Ruby has a GC. So classic leaks don't really exist. What does exist is bloat — and knowing the difference is what separates senior from junior here.
Debugging memory leaks in Ruby without crying
Classic symptoms:
- app starts at 200MB
- 1h later, 800MB
- 6h later, 2GB
- someone restarts the process
- cycle repeats
You don't have a leak.
You have memory bloat.
And they're different things.
Leak ≠ Bloat
Leak: you're allocating memory that's never released because something is holding an inappropriate reference.
Bloat: you allocate too much (in peaks or continuously) and Ruby doesn't return that memory to the OS even after GC.
Ruby has a GC, so a classic leak (C-style) doesn't exist.
What does exist:
- objects retained without you noticing
- glibc holding memory in arenas
- fragmentation preventing GC from compacting
Knowing the difference is the first step.
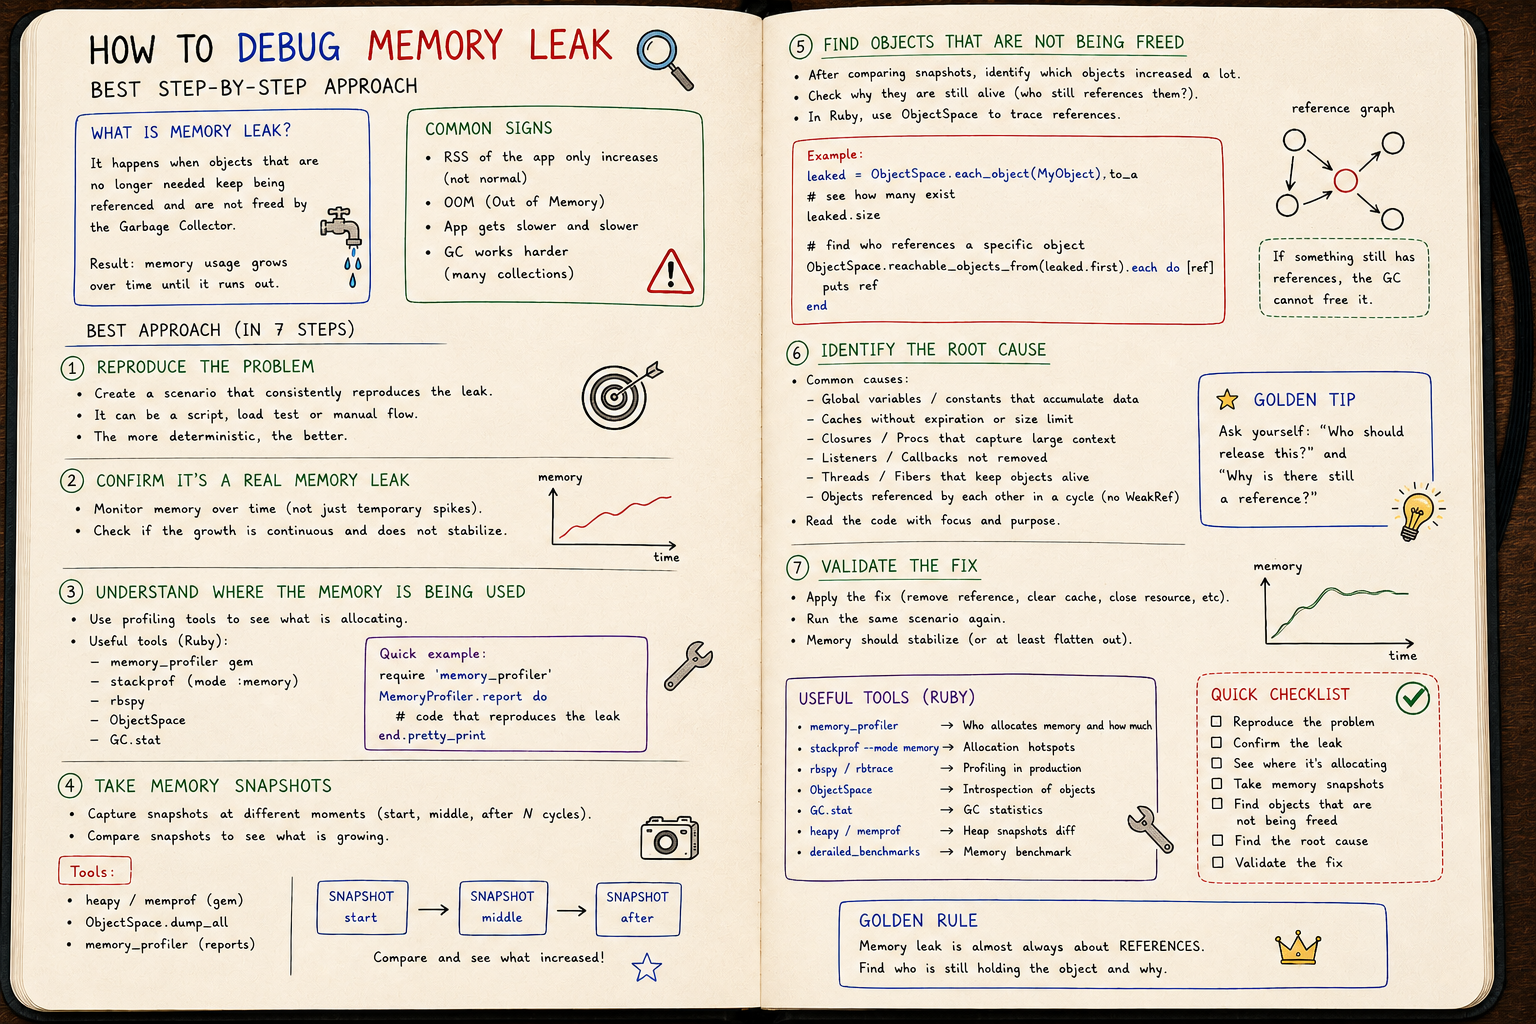
Tools worth learning
GC.stat
GC.stat
# => {:count=>10, :heap_allocated_pages=>200, :total_allocated_objects=>1_000_000, ...}
Gives you the panorama: how many GCs ran, how many objects allocated, how many free slots.
Look at intervals. Compare.
ObjectSpace
ObjectSpace.each_object(String).count
# => 187_432
Counts live objects of a specific class.
Growing endlessly between requests? Smells like a leak.
memory_profiler
A gem that shows allocations by file/line:
require 'memory_profiler'
report = MemoryProfiler.report do
  Rails.application.call(env)
end
report.pretty_print
Shows exactly where your app is allocating.
derailed_benchmarks
For Rails. Runs a scenario and tells you how much it grew.
$ bundle exec derailed exec perf:mem_over_time
Memory chart over time. You see if it stabilizes or just keeps climbing.
Pattern 1: cache that grows endlessly
class Service
  CACHE = {}

  def self.fetch(key)
    CACHE[key] ||= expensive_compute(key)
  end
end
Each new key adds an entry.
CACHE is a constant. Lives as long as the process lives.
Memory grows forever.
Fix: LRU, TTL, or just Rails.cache (which has eviction policy).
Pattern 2: Active Record loading too much
User.all.each do |user|
  process(user)
end
100k users = 100k AR objects loaded in memory.
Use find_each:
User.find_each(batch_size: 1000) do |user|
  process(user)
end
Processes in batches. Frees between them.
And for aggregate reports, pluck usually solves it:
User.pluck(:email) # just an array of strings
instead of loading full AR objects just to grab one column.
Pattern 3: closure capturing too much
def setup
  large_data = load_huge_file
  background_job = ->{ process(large_data) }
  Thread.new(&background_job)
end
The lambda captures large_data.
The thread lives as long as the app lives.
large_data is never collected.
Fix: pass only what you need. Avoid large captures in long-lived closures.
Pattern 4: glibc malloc
Ruby uses malloc by default. glibc's malloc has bad behavior: it creates arenas per thread and rarely returns memory to the OS.
Result: you see a Ruby process at 2GB, even after GC.
Popular fix: jemalloc or MALLOC_ARENA_MAX=2.
# running with jemalloc
LD_PRELOAD=libjemalloc.so ruby app.rb
In real production, many people reported 30-50% RSS drops just by swapping the allocator.
Doesn't fix leaks. But fixes bloat.
Investigation walkthrough
- Confirm it's leak/bloat. Is RSS growing monotonically? Does it ever stabilize?
- Initial snapshot:
GC.stat[:total_allocated_objects]. - Reproduce the scenario (request, job, loop).
- Final snapshot. What grew?
- Profile allocations with
memory_profileron the same scenario. - Identify suspect: cache, closure, constant, gem famous for leaking.
- Measure again after fixing. Without measuring, it's just guessing.
The golden rule: if you didn't measure, you didn't fix.
Heap dumps
For serious cases, heap dump:
require 'objspace'
ObjectSpace.trace_object_allocations_start

# ... reproduce scenario ...

GC.start
File.open("heap.json", "w") { |f| ObjectSpace.dump_all(output: f) }
Then you analyze with tools like heapy or custom scripts.
Lets you find:
- a live object that should have died
- who's holding the reference
- the exact line of allocation
It's the last resort. But it solves impossible cases.
The famous suspects
- Sidekiq + badly written middleware (retained closure)
- Rails cache fragments growing too big
- a gem that does
evalat runtime, accumulating bytecode - a background thread that never ends
- error logs with giant serialized objects
- views rendering huge partial trees
You won't memorize. But you'll start recognizing with time.
The big shift
Debugging memory in Ruby isn't trial and error.
It's a process:
- Measure
- Reproduce
- Hypothesize
- Profile
- Fix
- Measure again
Skipping steps means guessing.
Guessing while debugging memory costs you — you restart the process, pretend you fixed it, and the problem comes back.
Conclusion
Memory leaks in modern Ruby are extremely rare.
Memory bloat is daily.
Telling them apart is the first thing that separates senior from junior on this topic.
And learning to investigate memory makes you, along the way, respect the GC.
Which does an impressive job. Quiet. Constant.
Until the day you decide to fight it.