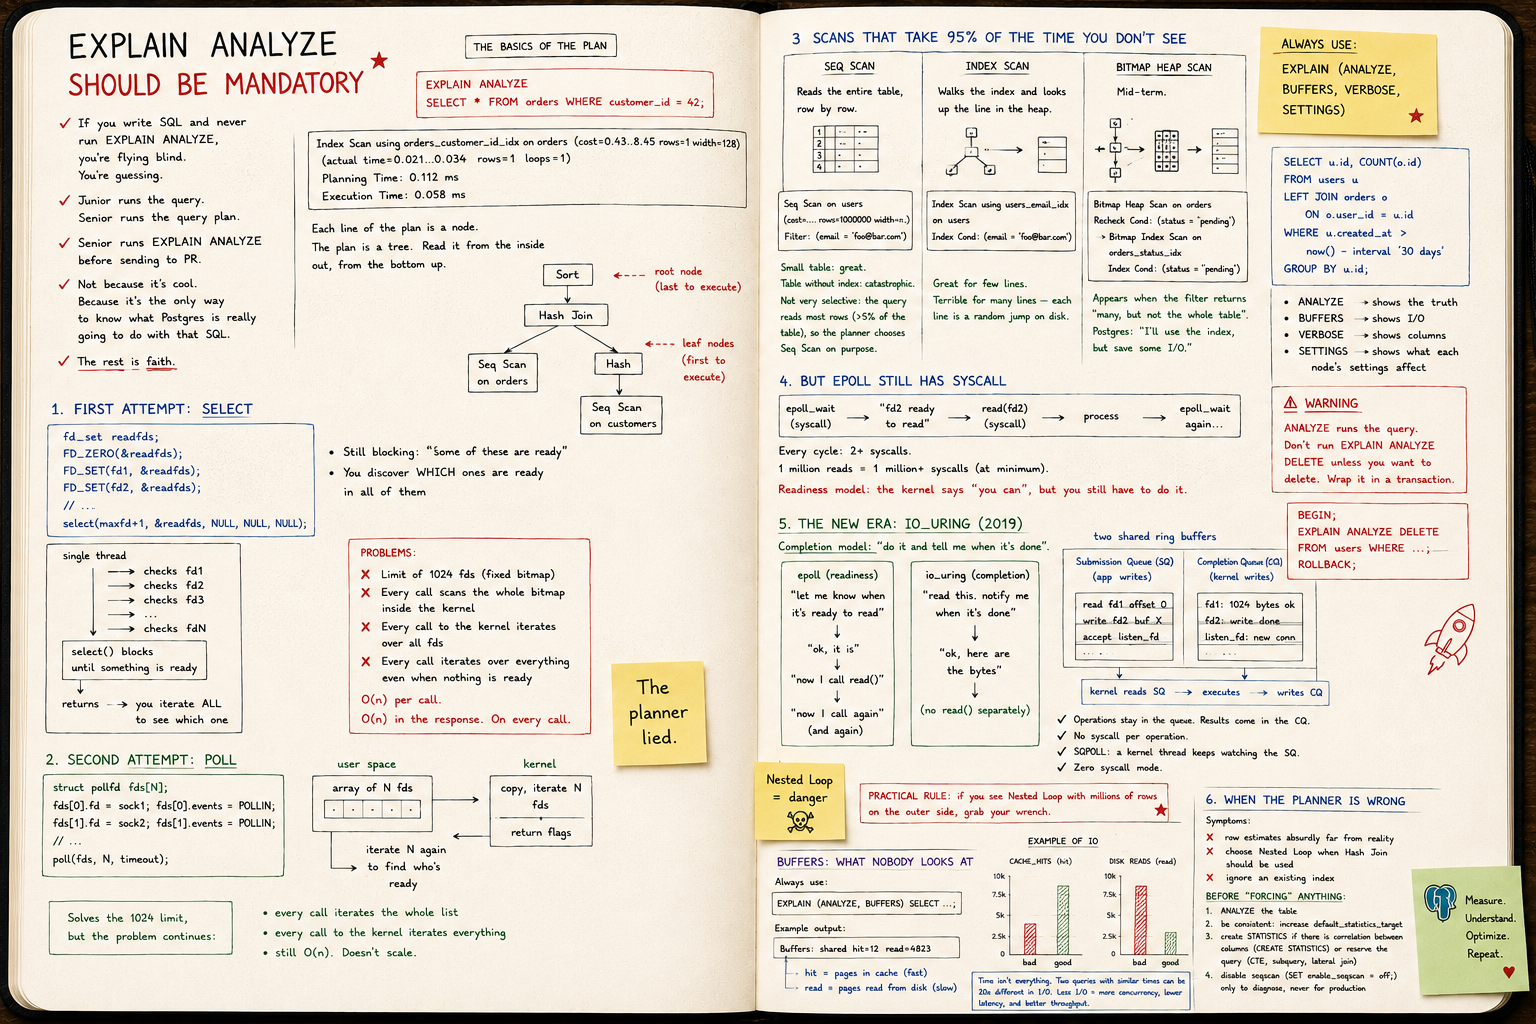
EXPLAIN ANALYZE should be mandatory
Junior runs the query. Senior runs the query plan. Seq Scan, Index Scan, Bitmap Heap, estimated vs actual, BUFFERS — reading the plan isn't optional, it's the job.
EXPLAIN ANALYZE should be mandatory
If you write SQL and have never run EXPLAIN ANALYZE, you don't write SQL.
You guess.
The query "works" in dev with 200 rows. In prod, with 20 million, it takes the database down.
The difference between someone who understands the database and someone who just uses it
Junior runs the query. Senior runs the query plan.
A senior opens EXPLAIN ANALYZE before sending the PR.
Not because it looks fancy. Because it's the only way to know what Postgres is actually going to do with that SQL.
The rest is faith.
Plan basics
EXPLAIN ANALYZE
SELECT * FROM orders WHERE customer_id = 42;
Typical output:
Index Scan using orders_customer_id_idx on orders
  (cost=0.43..8.45 rows=1 width=128)
  (actual time=0.021..0.034 rows=1 loops=1)
Planning Time: 0.112 ms
Execution Time: 0.058 ms
Every line of the plan is a node. The plan is a tree. You read it inside out, bottom up.
Sort
 └── Hash Join
      ├── Seq Scan on orders
      └── Hash
           └── Seq Scan on customers
The leaf node runs first. The result bubbles up.
Memorize that. Without it, the rest is noise.
The numbers that matter
Take any node:
Index Scan using orders_customer_id_idx on orders
  (cost=0.43..8.45 rows=1 width=128)
  (actual time=0.021..0.034 rows=1 loops=1)
cost=0.43..8.45— estimated cost in arbitrary planner units. Startup..total.rows=1— how many rows the planner thinks it will return.actual time=0.021..0.034— real time in ms. Startup..per execution.rows=1 loops=1— how many rows actually came back, times how many executions.
The cost unit is not ms. Don't translate it. It exists only so the planner can compare paths against each other.
What you want to compare is estimated rows vs actual rows.
The divergence that kills
Golden rule:
If estimated and actual
rowsdiverge by an order of magnitude, your statistics are rotten.
Classic example:
Seq Scan on orders
  (cost=... rows=12 width=...)
  (actual time=... rows=987432 loops=1)
Planner thought 12. Almost a million came back.
Result: it picked Nested Loop thinking it would run 12 times. It ran a million. Query hangs.
The cause is almost always one of two:
ANALYZEhasn't run on that table recently.- The column distribution is skewed and the default histogram doesn't capture it.
Immediate fix:
ANALYZE orders;
Real fix: raise default_statistics_target on the column, or create extended statistics (CREATE STATISTICS).
Seq Scan, Index Scan, Bitmap Heap Scan
The three you'll see 95% of the time. Memorize them.
Seq Scan
Reads the whole table, row by row.
Seq Scan on users  (cost=... rows=1000000 width=...)
  Filter: (email = 'foo@bar.com')
Small table: fine. Big table without an index: catastrophe.
Not always bad. If the query returns a lot of rows (say, >5% of the table), the planner chooses Seq Scan on purpose — it's cheaper than jumping through the index a thousand times.
Index Scan
Walks the index and fetches each matching row from the heap (the table itself).
Index Scan using users_email_idx on users
  Index Cond: (email = 'foo@bar.com')
Great for few rows. Bad if it returns many — each row is a random jump on disk.
Bitmap Heap Scan
Middle ground. Postgres reads the index, builds a bitmap of pages to visit, then reads the heap in physical order.
Bitmap Heap Scan on orders
  Recheck Cond: (status = 'pending')
  -> Bitmap Index Scan on orders_status_idx
       Index Cond: (status = 'pending')
Shows up when the filter returns "a lot, but not the whole table." It's Postgres saying: "I'll use the index, but save on IO."
The joins: Nested Loop vs Hash vs Merge
Nested Loop
For each row in A, look it up in B.
Nested Loop
  -> Seq Scan on a
  -> Index Scan on b
       Index Cond: b.a_id = a.id
Great if A is small. Hell if A has a million rows.
Hash Join
Builds a hash table from the smaller side, then scans the larger one.
Hash Join
  -> Seq Scan on big_table
  -> Hash
       -> Seq Scan on small_table
Good for medium/large tables. Costs memory (work_mem).
Merge Join
Sorts both sides and merges them. Useful when data already comes sorted (from an index, for example).
Rule of thumb: if you see Nested Loop with millions of rows on the outer side, you found your bottleneck.
BUFFERS: what nobody looks at
Always use:
EXPLAIN (ANALYZE, BUFFERS) SELECT ...;
The output gains lines like:
Buffers: shared hit=12 read=4823
hit— pages that were in cache (fast).read— pages that came from disk (slow).
If read is high and the query is frequent, either the cache can't fit the table or you're doing unnecessary IO.
Time isn't everything. Two queries with similar timings can have totally different IO footprints — and in prod, under concurrency, the one with more IO drags everyone down.
EXPLAIN (ANALYZE, BUFFERS, VERBOSE)
The combo I use by default:
EXPLAIN (ANALYZE, BUFFERS, VERBOSE, SETTINGS)
SELECT u.id, COUNT(o.id)
FROM users u
LEFT JOIN orders o ON o.user_id = u.id
WHERE u.created_at > now() - interval '30 days'
GROUP BY u.id;
ANALYZE— actually executes.BUFFERS— shows IO.VERBOSE— shows columns, schemas, output of each node.SETTINGS— shows non-default parameters affecting the plan.
Warning:
ANALYZEexecutes the query. Don't runEXPLAIN ANALYZE DELETEunless you want to delete. Wrap it in a transaction:
BEGIN;
EXPLAIN ANALYZE DELETE FROM users WHERE ...;
ROLLBACK;
When the planner is wrong
It happens. Postgres is good, not perfect.
Signs:
- row estimate absurdly far from reality
- picks Nested Loop when it should be Hash
- ignores an index that exists
Before "forcing" anything:
ANALYZE table;
Then, if it persists:
- raise
default_statistics_targeton the problem column - create
CREATE STATISTICSif there's correlation between columns - rewrite the query (materialized CTE, subquery, lateral join)
Last resort: session parameters like SET enable_nestloop = off; — useful for diagnosing, never to leave in production.
Inside Rails
.explain on any relation:
User.where(active: true).joins(:orders).explain
Output identical to psql. Goes to stdout in the console.
For ANALYZE, on Rails 7+:
User.where(active: true).explain(:analyze, :buffers)
On older versions, go straight to the database. Don't trust plain .explain alone — it doesn't execute, it only estimates. To catch the estimate-vs-actual divergence, you need ANALYZE.
Bonus: combine it with ActiveRecord::Base.logger to see the exact query being generated before explaining it.
Patterns that show up every week
Seq Scan on a big table with a selective filter
Missing index. Create it.
CREATE INDEX CONCURRENTLY orders_status_idx ON orders(status);
Index Scan returning millions of rows
Wrong index for the case. You probably need a Bitmap, or a composite index, or shouldn't be filtering on that column at all.
Nested Loop with loops=1000000
The outer side blew up. Probably a bad estimate. Run ANALYZE and look again.
Sort with external merge Disk
Not enough work_mem. The sort spilled to disk.
Sort Method: external merge Disk: 41216kB
Raise work_mem for the session or build an index that already returns sorted.
Hash with Batches: 8
Same problem, hash didn't fit in memory, fell back to batches.
The big shift
You don't optimize SQL by writing "prettier" SQL.
You optimize by reading the plan and changing the way Postgres will execute.
Every real query optimization goes through:
1. EXPLAIN ANALYZE BUFFERS
   ↓
2. Find the most expensive node
   ↓
3. Understand why it's expensive (estimate? IO? wrong join?)
   ↓
4. Change something (index, query, statistic)
   ↓
5. EXPLAIN ANALYZE again — confirm
Without steps 1 and 5, it's a hunch.
Conclusion
Looking at the plan is not optional.
It's the only honest way to know what your database is doing.
The "fast in dev, slow in prod" query is almost always a query nobody looked at the plan for in prod — with prod data, prod statistics, prod concurrency.
Memorize the three scans. Memorize the three joins. Turn on BUFFERS by default. Distrust any divergence between estimated and actual.
Do that for six months and you become the person the team calls when something is slow.
Not because you're a genius.
Because you read the plan.