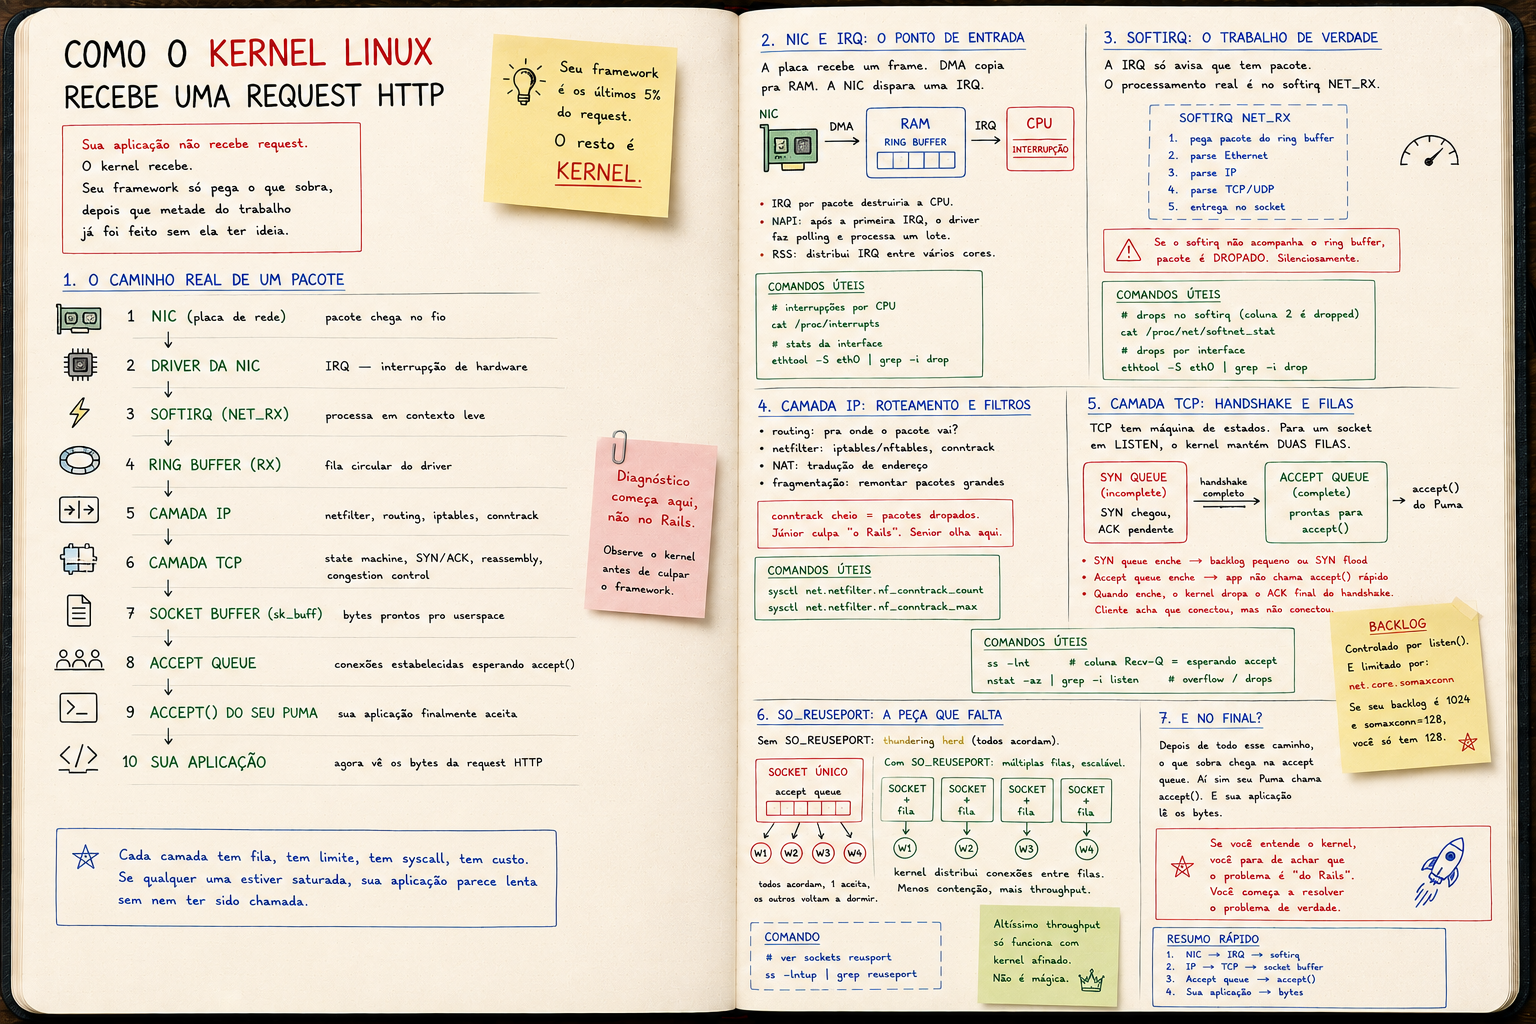
How the Linux kernel actually receives an HTTP request
NIC → driver → IRQ → softirq → IP → TCP → socket buffer → accept queue → Puma. Your framework is the last 5% of the request. The rest is kernel.
How the Linux kernel actually receives an HTTP request
Your application doesn't receive the request.
The kernel does.
Your app just picks up the leftovers, after half the work has already been done without it having any idea.
And while you don't understand those layers, you keep saying "Rails is slow", "Node is fast", "Go scales". All guessing.
The real path of a packet
A curl http://api.example.com/users/1 doesn't land in your Puma out of nowhere.
There's a whole journey before:
   network card (NIC)
        │  packet arrives on the wire
        ▼
   NIC driver
        │  IRQ — hardware interrupt
        ▼
   softirq (NET_RX)
        │  processes in light context
        ▼
   ring buffer (RX)
        │  driver's circular queue
        ▼
   IP layer (netfilter, routing)
        │  iptables, conntrack, etc.
        ▼
   TCP layer (state machine)
        │  SYN/ACK, reassembly, congestion
        ▼
   socket buffer (sk_buff)
        │  bytes ready for userspace
        ▼
   accept queue
        │  established connections
        ▼
   your Puma's accept()
        │
        ▼
   your app finally sees the bytes
Each of those layers has a queue, a limit, a syscall, a cost.
And if any of them is saturated, your application looks slow without having even been called.
NIC and IRQ: the entry point
The network card receives an Ethernet frame.
DMA copies the frame straight into a RAM buffer.
Then the NIC fires an IRQ — a hardware interrupt. The CPU drops whatever it was doing and runs the driver's handler.
NIC ────DMA────► RAM (ring buffer)
 │
 └── IRQ ──► CPU stops everything, services it
IRQ is expensive. On a high-throughput server, millions of packets/s, one IRQ per packet would destroy the CPU.
That's why NAPI (New API) exists: after the first IRQ, the driver switches to polling mode. Instead of one interrupt per packet, it processes a batch.
And on serious servers you also use RSS (Receive Side Scaling) to spread IRQs across multiple cores — otherwise one core handles everything while the others sit idle.
If you've never looked at /proc/interrupts, never set up IRQ affinity, never tuned a ring buffer — fine, but know that someone else is doing it, and that's why their server handles 100x your load.
Softirq: the actual work
The IRQ just signals: "there's a packet". That's it.
The real processing happens in softirq — a lighter context scheduled by the kernel.
IRQ (short)
   │
   └─► wakes softirq NET_RX
              │
              └─► processes packets from ring buffer
                  ├── parse Ethernet
                  ├── parse IP
                  ├── parse TCP
                  └── deliver to socket
If softirq can't keep up with the ring buffer, packets get dropped. Silently.
# packets dropped at softirq level
cat /proc/net/softnet_stat

# drops per interface
ethtool -S eth0 | grep -i drop
Juniors never look at this. Seniors look first.
IP layer: routing and filters
The packet moves up to IP.
Here lives:
- routing: where is this packet going?
- netfilter: iptables, nftables, conntrack
- NAT: address translation
- fragmentation: reassembling large packets
conntrack is particularly treacherous. A server with lots of short connections blows the table and starts dropping:
sysctl net.netfilter.nf_conntrack_count
sysctl net.netfilter.nf_conntrack_max
I've seen production dying from this with the team blaming "Rails".
TCP layer: handshake and queues
This is where it gets interesting.
TCP is a state machine. And for a socket in LISTEN (your Puma waiting), the kernel keeps two queues:
                  SYN packet arrives
                          │
                          ▼
              ┌───────────────────────┐
              │   SYN queue           │  ← "half-open" connections
              │   (incomplete)        │     SYN received, ACK pending
              └───────────┬───────────┘
                          │ handshake completes
                          ▼
              ┌───────────────────────┐
              │   accept queue        │  ← ready for accept()
              │   (complete)          │
              └───────────┬───────────┘
                          │
                          ▼
                  Puma's accept()
Two queues. Two places things can go wrong.
The SYN queue fills up under SYN flood or if the backlog is too small.
The accept queue fills up if your app doesn't call accept() fast enough. When it fills, the kernel drops the final ACK of the handshake. The client thinks it's connected, but it isn't. Mysterious timeout.
# track accept queue overflow
nstat -az | grep -i listen
ss -lnt   # Recv-Q column = waiting for accept
The backlog is set by listen():
listen(sockfd, 1024); // accept queue size
And by the sysctl net.core.somaxconn. If your Puma asks for 1024 but the sysctl is 128, you get 128. I've seen this break load tests a thousand times.
SO_REUSEPORT: the missing piece
Traditionally, one socket = one accept queue.
Multiple Puma workers share the same socket, and the kernel wakes one to do accept. But when many workers compete, you get thundering herd: all wake up, one wins, the rest go back to sleep. Waste.
SO_REUSEPORT changes the game:
without SO_REUSEPORT:        with SO_REUSEPORT:

  ┌─ single socket ─┐         ┌─ socket ─┐ ┌─ socket ─┐ ┌─ socket ─┐
  │  accept queue   │         │   queue  │ │   queue  │ │   queue  │
  └────────┬────────┘         └────┬─────┘ └────┬─────┘ └────┬─────┘
           │                       │            │            │
   ┌───┬───┼───┬───┐           worker 1      worker 2     worker 3
   w1  w2  w3  w4              (kernel hashes the 4-tuple
   (all compete)                and distributes — no competition)
Each worker has its own accept queue. The kernel distributes connections by hashing the (src_ip, src_port, dst_ip, dst_port). No competition. No thundering herd.
Serious modern servers use this by default. Puma supports it. Nginx supports it. If you're not using it, you're leaving throughput on the table.
Socket buffer: where the bytes wait
Every TCP socket has a buffer in the kernel:
   network ──► sk_buff (recv buffer) ──► app's read()/recv()
                  │
                  └── size controls TCP window
net.core.rmem_max, net.ipv4.tcp_rmem — these control how much can sit buffered.
If the app doesn't read fast enough, the buffer fills, the TCP window closes, the sender stops sending. Pure backpressure.
And that's why blocking a Puma thread with synchronous IO is so bad: the socket fills, the client waits, the accept queue fills, and the whole server chokes.
And epoll?
Before calling accept(), Puma uses epoll to know when there's something to accept.
epoll_ctl(epfd, EPOLL_CTL_ADD, listen_sock, &ev);
epoll_wait(epfd, events, max, timeout);
// returns: "there's a connection on the accept queue"
accept4(listen_sock, ...);
Without epoll, you'd be calling accept() in a loop (busy wait) or blocking one thread per socket. Both terrible.
epoll is what lets one thread watch thousands of sockets. It's the engine of Linux concurrency. Worth its own article — and it has one.
Userspace finally enters
After all that:
accept() returns ──► new file descriptor
       │
       ▼
   Puma worker grabs the fd
       │
       ▼
   read() bytes of the HTTP request
       │
       ▼
   HTTP parser (in Ruby or C)
       │
       ▼
   builds Rack env
       │
       ▼
   Rails.application.call(env)
This is where your "framework" starts.
Everything before was done by the kernel, the driver, the NIC, by Puma. You had no control over any of it.
Symptoms vs real cause
Senior vs junior here is simple:
Junior: "Rails is slow, I'm switching frameworks."
Senior: "Accept queue is overflowing, I'll raise the backlog, find out why the worker is slow to accept, and turn on SO_REUSEPORT."
Scenarios that look like "slow app" but are actually kernel:
- Handshake timeouts → accept queue overflow
- Connections vanishing randomly → conntrack full
- Throughput hitting a ceiling → small ring buffer, IRQ pinned to one core
- High latency under load → bufferbloat, RTT inflated by queueing
None of these get fixed by changing your ORM.
Commands to keep in your pocket
ss -lnt                          # listening sockets, Recv-Q, Send-Q
ss -s                            # summary of TCP states
nstat -az | grep -i drop         # drops at various layers
cat /proc/net/softnet_stat       # softirq stats
ethtool -S eth0 | grep drop      # NIC-level drops
sysctl net.core.somaxconn        # max accept queue
sysctl net.ipv4.tcp_max_syn_backlog
cat /proc/interrupts             # IRQs distributed across CPUs
Learn these. They're far more useful than 90% of the gems you install.
The shift
The HTTP request your app sees is the end of a journey, not the start.
Before your controller ever exists:
- the NIC grabbed the frame
- the driver moved it to RAM
- softirq parsed TCP/IP
- the kernel completed the handshake
- the accept queue held the connection
- epoll woke the worker
- accept() returned an fd
- read() pulled bytes off the buffer
- the HTTP parser built the env
Only then does Rails.application.call(env) run.
Conclusion
Your backend framework is the last 5% of the request lifecycle.
The other 95% is kernel, driver, NIC, queue, syscall, scheduler.
People who only understand the framework debug in the dark when things get tight.
People who understand the whole stack open ss, open nstat, open /proc/net/softnet_stat, and in two minutes know whether the problem is Ruby or the kernel screaming that the accept queue is overflowing.
Linux is not the background.
Linux is the stage.
Your Rails just dances on top of it.