How to identify a performance bottleneck in minutes
Every slow app has ONE dominant bottleneck. Guessing doesn't cut it. Learn the suspect hierarchy, the right tools and the workflow that goes straight to the cause.
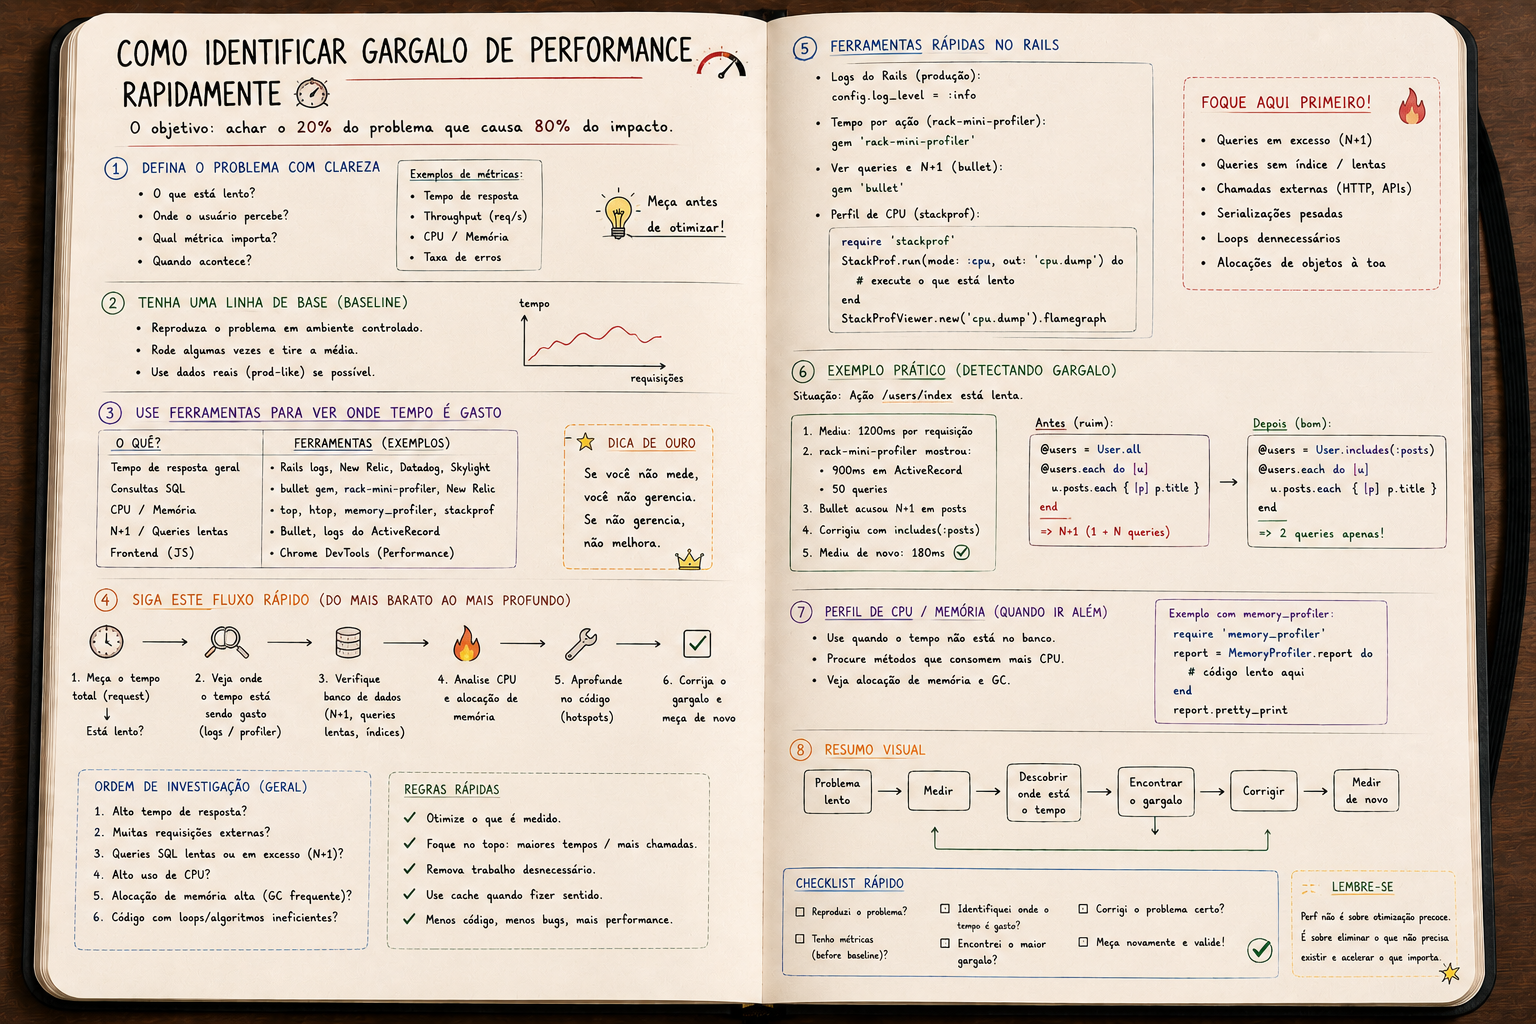
How to identify a performance bottleneck in minutes
Every slow application has a bottleneck.
Usually ONE, dominant. Not ten.
The difference between someone who optimizes and someone who just guesses is knowing where to look first.
Golden rule: measure, don't assume
"I think it's the database."
"I think it's Ruby."
"I think it's serialization."
Guessing is the biggest source of wasted time in optimization.
Before any action:
- where is the time being spent?
- in which layer?
- in which request?
- with what frequency?
Without that, optimization is a lottery.
The suspect hierarchy
Order them like this. It's what shows up in 90% of cases.
1. Database
   ├── N+1 queries
   ├── query without an index
   ├── query scanning too many rows
   └── lock waiting

2. External IO
   ├── synchronous HTTP call
   ├── upload/download
   └── reading a large file

3. Application
   ├── heavy serialization (giant JSON)
   ├── complex view rendering
   ├── too much allocation (GC pressure)
   └── bad algorithmic logic (O(n²) loop)

4. Infrastructure
   ├── missing connection pool
   ├── thread starvation
   ├── memory hitting swap
   └── saturated CPU
Start at the top. It's almost always there.
Tools that pay your salary
APM (Datadog, New Relic, Skylight, Scout)
Shows:
- average time per endpoint
- breakdown: DB / Ruby / view / external
- traces of slow requests
If you don't have APM in prod, stop everything and set one up.
You can't optimize what you can't see.
rack-mini-profiler
Local. Puts a badge in the corner of the page with the time of each query.
gem 'rack-mini-profiler'
gem 'memory_profiler'
gem 'flamegraph'
gem 'stackprof'
In dev, identifies N+1 and slow queries on the spot.
bullet
Detects N+1 and yells at you in the log:
USE eager loading detected
  User => [:posts]
  Add to your finder: :includes => [:posts]
Difference between senior and junior devs:
- junior comments out bullet so "the log stays clean"
- senior fixes what it points to
stackprof
Sampling profiler. Shows where the CPU was at each sample:
require 'stackprof'
StackProf.run(mode: :cpu, out: 'tmp/stackprof.dump') do
  expensive_operation
end
Then:
stackprof tmp/stackprof.dump
Result: a list of methods burning CPU, in order.
flamegraph
Graphical visualization of stack traces. Great for seeing where time concentrates.
pgBadger (Postgres)
Analyzes Postgres logs and shows the slowest queries, most frequent ones, ones with biggest total time.
When the problem is in the database, that's where the truth shows up.
Symptoms and quick diagnosis
"The app started getting slow about a week ago"
- A table grew without an index keeping up.
- A recent migration changed query behavior.
- A new endpoint being hammered in a loop by a badly-written frontend.
"Slow only during peak hours"
- Insufficient connection pool.
- Database locks.
- Saturated CPU.
"Always slow, even with few users"
- N+1.
- Missing index.
- Absurd serialization (Active Model Serializers on a big collection).
"Random short freezes"
- GC pause.
- Thread starvation.
- Blocking IO.
"Memory climbs and never comes down"
- Bloat (jemalloc, MALLOC_ARENA_MAX).
- Cache growing.
- Closure holding an object.
These patterns cover most cases. Memorize them.
Practical shortcuts
1. Look at the production log.
Rails prints total and DB time:
Completed 200 OK in 4523ms (Views: 234.5ms | ActiveRecord: 4001.2ms)
If DB > 80% of the total, go straight to the query.
2. EXPLAIN ANALYZE in Postgres.
EXPLAIN ANALYZE SELECT * FROM users WHERE email = 'foo@bar.com';
Tells you if it's using an index, how many rows it scanned, estimated vs actual cost.
If you see Seq Scan on a big table, you found the problem.
3. User.where(...).explain in Rails.
Same thing, via console:
User.where(active: true).joins(:posts).explain
4. Count queries per request.
queries = []
ActiveSupport::Notifications.subscribe("sql.active_record") do |*, payload|
  queries << payload[:sql]
end

# run the request

puts queries.count
More than 30 queries per request is an alert. More than 100, an emergency.
The micro-optimization trap
I see this every week:
# before
users.map { |u| u.name }

# after (someone read a blog about symbol-to-proc)
users.map(&:name)
Gain: irrelevant.
Meanwhile the same person has N+1 loading 10,000 records to show 5.
Micro-optimization without profiling is ego massage.
The rule: a 10x bottleneck deserves 100% of your time. A 5% gain didn't even deserve your attention.
The correct workflow
1. Measure (APM, profiler, logs)
   ↓
2. Identify TOP 3 slowest
   ↓
3. Take the worst — investigate only it
   ↓
4. Reproduce locally (request, query)
   ↓
5. Hypothesize root cause
   ↓
6. Fix
   ↓
7. Measure again — confirm the gain
   ↓
8. Repeat
8 steps. None optional.
The big shift
Performance isn't "making Ruby go faster".
It's finding where time is being spent and attacking the right point.
Most of a Rails web app's time is in IO (database, network, disk).
You don't optimize that by making your Ruby smarter.
You optimize by doing less IO.
Conclusion
The difference between people who optimize well and people who just "try stuff":
- uses the right tool
- measures before and after
- goes for the biggest offender
- ignores ego from "clever optimizations"
Performance, deep down, is discipline.
More than technical knowledge.
You can master every tool and still waste time if you don't know where to start.
Start with the database. Always.
You'll be right on most days.